Digital Bootcamp - Intensive Class

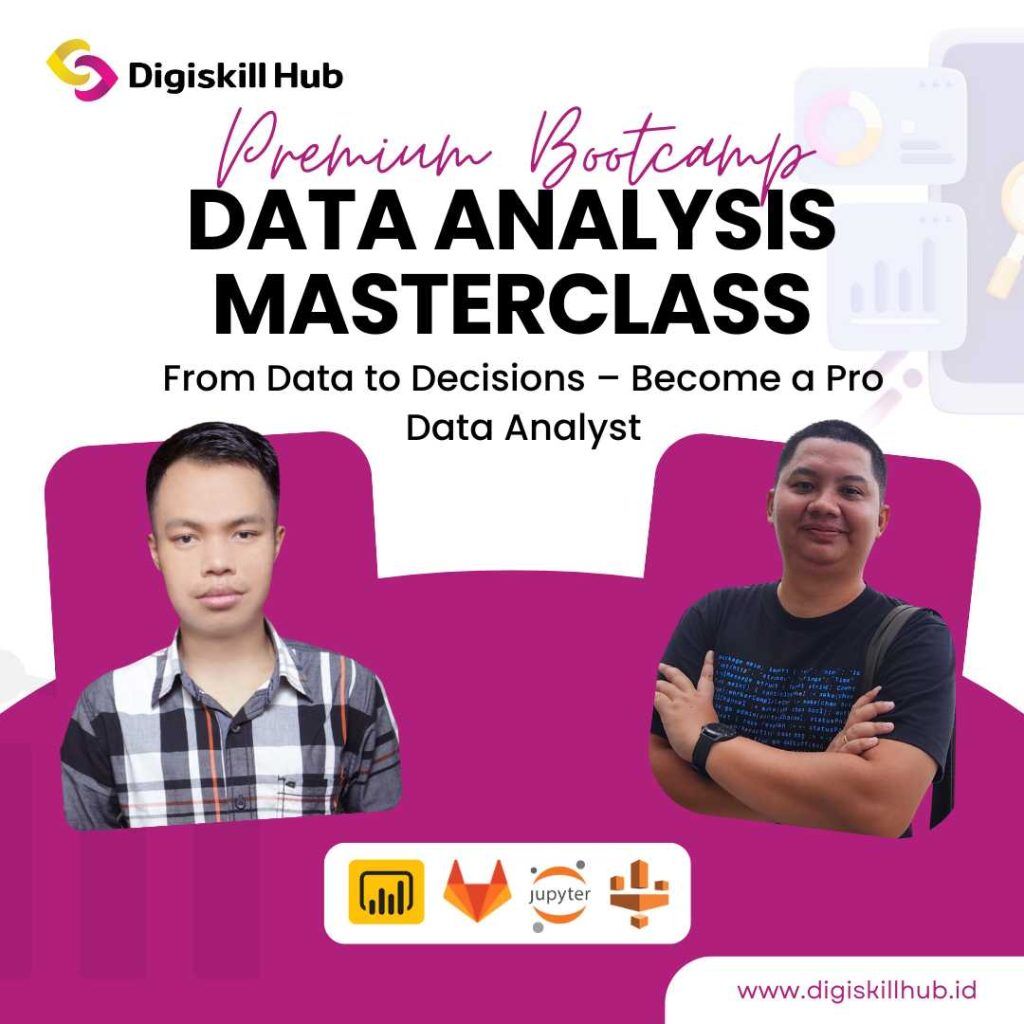
Data Analysis Masterclass

"From Data to Decisions – Become a Pro Data Analyst"

gambar-kelas-dataanalyst

📚 Kenapa harus belajar Data Analysis Masterclass​?

👨‍🏫 Trainer yang akan mengajar 👩‍🏫

tim-Mentor-Data-Science

Yoshua C Putro

System, AI/ML & Data Expert

System Architecture, Machine/ Deep Learning, Big Data & BI, Cloud Computing.

foto-trainer-ke-11

Refanda S

AI/ML & Software Engineer

Software & Data Engineering, Big Data, Data Science, AI/ML Development, Microservices.

Shabina Kayana

Senior Data Analyst

System Architecture, IT Project Management, SDLC, Business Intellegent, dll.

🎯 Target dan Sasaran kelas bootcamp ini

  • Membekali peserta dengan skill Data Analyst yang komprehensif mulai dari pengumpulan data, pemrosesan data menggunakan alat-alat analisa data modern hingga pembuatan laporan analisa yang informatif sebagai alat pengambil keputusan.
  • Mendorong peserta mengembangkan keterampilan analitis yang lebih tajam dalam mengolah dan menganalisis data besar, yang penting untuk mengidentifikasi tren, pola, dan wawasan yang dapat mendorong keputusan bisnis yang lebih baik
  • Penguasaan Alat dan Teknik Analisis Data Terbaru
  • Dengan menguasai teknik dan metodologi analisis data yang relevan, peserta siap memasuki dunia profesional sebagai data analyst yang mampu memberikan kontribusi berharga dalam pengambilan keputusan berbasis data, serta meningkatkan peluang untuk bekerja di berbagai sektor industri.

💻 Topik yang akan dipelajari

  • Introduction to Data Analysis
  • Statistic for Data Analyst
  • Fundamental for Coding in Python
  • Mathematics for Phyton
  • SQL for Data Analysis
  • Chat GPT for Data Analysis
  • Digital Data Analysis
  • Advance Data Analysis
  • Data Visualization
  • Creating Data Driven Strategy & Executive Dashboard
  • Project Portofolio

🎁 Benefit yang didapat

ikon-dibimbing-it=expert

Dibimbing IT Expert &
Top Level Management Industri

ikon-fleksibelitas-program

Fleksibilitas Program dan
Fokus Skillset Tertentu

ikon-sertifikat

Sertifikat Diterbitkan CCIT FT-UI
(Universitas Indonesia)

ikon-belajar-dan-upgrade

3+ Bulan Belajar & Upgrade Skill Bareng Praktisi Top Industri

ikon-pendamping-24jam

Pendampingan Personal dan
24 Jam Akses Materi via LMS

ikon-bonus-eksklusif

Bonus Eksklusif 2 Materi Soft Skill
Buat Siap Kerja!

⚙️ Tools yang akan digunakan

jupyter-icon

Jupyter Notebook

gitlab-icon

Gitlab

tensorflow-icon

TensorFlow

docker-icon

Docker

power-bi-icon

Power BI

python-icon

Python

numpy-icon

NumPy

pandas-icon

Pandas

Scrapy

spark-icon

Apache Spark

airflow-icon

Apache Airflow

looker-icon

Looker

XGBoost

AWS Glue icon

AWS Glue

ggl-dataflow-icon

Google Dataflow

nltk-icon

NLTK

spacy-icon

spaCy

hugging-face-icon

Hugging Face Transformer

open-ai-icon

Open AI API

Kubernetes

Kubernetes

📝 Proyek yang akan dikerjakan

  • Analisis Performa Penjualan Perusahaan

  • Analisis Data Media Sosial: Sentimen & Engagement Kampanye Brand

  • Studi Analisis Customer Churn pada Layanan Berlangganan

  •  Analisis Efisiensi Operasional di Divisi Produksi

🏢 Prospek karir

📢 Untuk siapa kelas ini?

  • Mahasiswa (UI & Non UI) dan Umum yang ingin belajar dan memperkaya portofolio
  • Fresh Graduate untuk posisi data-related
  • Profesional IT yang Ingin memperluas keahlian ke bidang data
  • Freelancer / Fresh Graduate yang sedang Reskilling / Upskilling

🕣 Jadwal

  1. Live Zoom setiap Senin dan Rabu pukul 18.30 – 21.30 (Malam)
  2. Durasi kelas 2,5 – 3 jam per sesi selama 3 bulan.
  3. Pendaftaran segera dibuka

🗂️ Teknis Pelaksanaan

  1. Peserta yang melakukan pendaftaran, wajib join di group Whatsapp yang diberikan.
  2. Setiap sesi live akan dilaksanakan secara online menggunakan Zoom selama 24x pertemuan dilanjutkan dengan project portofolio dan bimbingan softskill untuk siap kerja dan pengembangan karir.
  3. Peserta wajib aktif di platform LMS (Learning Management System) baik dalam pembelajaran maupun forum kolaborasi.
  4. Peserta dapat mendownload ataupun mengakses materi belajar termasuk sampel source code (khusus kelas programming) di LMS.
  5. Peserta dapat bertanya dan berdiskusi dengan mentor dan peserta lain terkait materi, tugas dan konsultasi di LMS.

Module 1: Introduction to Data Analysis

Topic: Overview of Data Analysis

  • Introduction to Data Analysis & Its Business Impact

Topic: Overview of BI & Data Warehousing

  • Understanding Business Intelligence (BI) & Its Role in Decision-Making
  • BI vs. Traditional Reporting: Key Differences
  • Overview of Data Warehousing Concepts
    – ETL (Extract, Transform, Load)
    – Data Marts & OLAP (Online Analytical Processing)

Topic: Overview of AI & Big Data Analysis

  • Introduction to AI in Data Analytics
    – Machine Learning & Deep Learning Overview
    – AI-Powered Business Use Cases (Fraud Detection, Customer Insights)
  • Big Data Analysis Fundamentals
    – Structured vs. Unstructured Data
    – Big Data Technologies (Hadoop, Spark, Cloud Platforms)
  • Overview of Data Warehousing Concepts
    – ETL (Extract, Transform, Load)
    – Data Marts & OLAP (Online Analytical Processing)

Module 2: Statistic for Data Analyst

Topic: Predictive Analysis

  • Introduction to Predictive Analytics
    – Role in Forecasting & Risk Management
    – Business Use Cases (Customer Retention, Sales Forecasting, Fraud Detection)
  • Predictive Modeling Techniques
    – Regression Analysis (Linear, Logistic)
    – Classification Models (Decision Trees, Random Forest, SVM)
    – Time-Series Forecasting (ARIMA, LSTMs)
    – Evaluating Model Accuracy (RMSE, R-Squared, Confusion Matrix)
  • AI & ML in Predictive Analytics
    – Machine Learning Pipelines for Predictive Modeling
    – Deep Learning for Forecasting Trends
  • Hands-on:
    – Building a Predictive Model Using Python (Scikit-Learn, TensorFlow)
    – Forecasting Business KPIs with Time-Series Data

Topic: Supervised vs. Unsupervised Learning

  • Supervised Learning:
  • Regression & Classification Techniques
  • Common Algorithms (Linear Regression, Decision Trees, SVM, etc.)
  • Model Evaluation & Performance Metrics (RMSE, Accuracy, Precision, Recall)
  • Unsupervised Learning:
  • Clustering & Dimensionality Reduction Techniques
  • K-Means, Hierarchical Clustering, PCA
  • Applications in Anomaly Detection & Customer
  • Segmentation Hand-on:
  • Implementing a Supervised ML Model using Python (Scikit-learn)
  • Performing Clustering Analysis on real-world data

Topic: Bias & Fairness in AI Models

  • Understanding Bias in Data & AI Models
  • Types of Bias: Selection Bias, Confirmation Bias, Algorithmic Bias
  • Fairness Metrics in AI: Demographic Parity, Equalized Odds
  • Techniques to Mitigate Bias in Machine Learning Models
  • Hand-on: Analyzing bias in an ML model and applying mitigation techniques

Topic: AI Model Deployment & MLOps Overview

  • Introduction to MLOps & AI Model Lifecycle
  • Model Deployment Strategies (On-Premise, Cloud, Edge AI)
  • CI/CD for Machine Learning Models
  • Monitoring AI Models in Production & Performance Optimization
  • Hand-on: Deploying an ML Model on a Cloud Platform (AWS, Azure, or Google Cloud)

Module 4:Mathematics for Phyton

Topic: Linear Algebra (Vectors, Matrices)

  • Understanding Vectors & Spaces
    – Scalars, vectors, and vector spaces
    – Linear combinations and basis vectors
    – Dot product, cross product, and norms
  • Matrix Operations & Transformations
    – Matrix addition, multiplication, and inverses
    – Eigenvalues and eigenvectors
    – Singular Value Decomposition (SVD)
  • Applications in Data Analysis
    – Dimensionality reduction (PCA)
    – Feature engineering using linear algebra
    – Matrix factorization in recommender systems
  • Hands-on:
    – Perform basic vector and matrix operations using NumPy
    – Compute eigenvalues and eigenvectors for real-world datasets
    – Apply PCA to reduce dimensionality in a dataset
    – Implement matrix factorization for a recommendation system

Module 4: Mathematics for Phyton

Topic: Probability and Distributions

  • Fundamentals of Probability
    – Probability rules and Bayes’ theorem
    – Conditional probability and independence
    – Random variables and expected values
  • Statistical Distributions
    – Normal, binomial, Poisson, and exponential distributions
    – Central Limit Theorem and Law of Large Numbers
    – Hypothesis testing and confidence intervals
  • Applications in Data Analysis
    – Monte Carlo simulations
    – Probability in A/B testing and decision-making
    – Bayesian inference for predictive modeling
  • Hands-on:
    – Simulate probability distributions using NumPy and SciPy
    – Conduct A/B testing with real-world datasets
    – Implement a Monte Carlo simulation for risk analysis
    – Use Bayesian inference to update probabilities based on new data

Module 5: SQL for Data Analysis

Topic: SQL Basics (SELECT, WHERE, JOIN, GROUP BY)

  • Introduction to SQL & Relational Databases
    – SQL syntax and query structure
    – Understanding tables, relationships, and normalization
  • Retrieving Data with SELECT & Filtering with WHERE
    – Basic SELECT statements
    – Using WHERE for filtering data
    – Applying logical operators (AND, OR, NOT)
  • Joining Tables & Aggregating Data
    – INNER JOIN, LEFT JOIN, RIGHT JOIN, and FULL JOIN
    – GROUP BY and HAVING for data aggregation
    – Using aggregate functions (SUM, COUNT, AVG, MIN, MAX)
  • Hands-on:
    – Write queries to retrieve specific records from a database
    – Join multiple tables to analyze sales and customer data
    – Use GROUP BY and HAVING to analyze revenue trends

Module 6: Chat GPT for Data Analysis

Topic: Using AI for Data Analysis & Report Generation

  • Introduction to AI in Data Analysis
    – How AI enhances traditional data analysis methods
    – Key AI models used for data processing
  • Generating Reports with AI
    – Automating executive summaries from datasets
    – AI-driven visualization and data storytelling
  • Predictive Analytics & AI-Driven Decision Making
    – Using AI models for trend forecasting
    – Identifying patterns and anomalies in datasets
  • Hands-on:
    – Generate automated data reports using AI tools
    – Use AI for trend detection and forecasting
    – Compare AI-driven vs. manual insights in real-world datasets

Topic: Automating Data Cleaning & Summarization

  • AI for Data Cleaning
    – Detecting and handling missing values
    – Identifying and correcting data inconsistencies
  • Data Summarization with AI
    – Using AI to generate insights from large datasets
    – Creating concise data summaries for decision-making
  • Automating Data Preprocessing in Python
    – Implementing AI-powered data transformations
    – AI-based anomaly detection and correction
  • Hands-on:
    – Use AI to clean and preprocess messy datasets
    – Generate concise AI-driven dataset summaries
    – Automate outlier detection and correction in Python

Module 7: Digital Data Analysis

Topic: Web Analytics (Google Analytics, Adobe Analytics)

  • Introduction to Web Analytics
    – Key performance indicators (KPIs) for website traffic
    – Understanding sessions, bounce rate, conversion rate
  • Google Analytics & Adobe Analytics Fundamentals
    – Setting up tracking codes and tags
    – Analyzing user behavior, traffic sources, and demographics
  • Custom Reporting & Data Interpretation
    – Creating and automating reports
    – Measuring ROI and optimizing conversion rates
  • Automating Data Wrangling Workflows
    – Using Python Libraries: Pandas, NumPy, Dask
    – Writing Efficient Data Pipelines
  • Hands-on:
    – Set up a Google Analytics dashboard and analyze real-time data
    – Track and interpret user behavior metrics for performance optimization
    – Create custom reports and actionable insights for business improvement

Topic: Social Media & Customer Behavior Analysis

  • Understanding Social Media Analytics
    – Key metrics: engagement, reach, impressions, conversions
    – Differences between organic and paid media analytics
  • Customer Behavior & Sentiment Analysis
    – Identifying user preferences and purchase intent
    – Sentiment analysis using AI tools for brand reputation management
  • Competitor & Trend Analysis
    – Benchmarking against competitors using social media data
    – Predicting trends with data-driven social listening tools
  • Hands-on Activities:
    – Analyze engagement and audience demographics using Facebook, Instagram, and Twitter insights
    – Conduct sentiment analysis on social media comments and reviews
    – Track and compare competitor performance using analytics tools

Module 8: Advance Data Analysis

Topic: Predictive Analytics & Machine Learning Basics

  • Introduction to Predictive Analytics
    – Definition and real-world applications
    – Supervised vs. unsupervised learning
  • Fundamentals of Machine Learning
    – Regression models (linear, logistic)
    – Classification models (decision trees, SVM, neural networks)
  • Model Evaluation & Performance Metrics
    – Accuracy, precision, recall, and F1-score
    – Cross-validation and overfitting prevention
  • Hands-on:
    – Build a simple linear regression model for predicting sales
    – Train and test a classification model using real-world datasets
    – Evaluate and tune models using hyperparameter optimization

Topic: Time Series Analysis

  • Understanding Time Series Data
    – Identifying trends, seasonality, and cyclic patterns
    – Moving averages and exponential smoothing
  • Time Series Forecasting Models
    – ARIMA (AutoRegressive Integrated Moving Average)
    – Prophet for forecasting (developed by Facebook)
  • Evaluating Time Series Predictions
    – Mean Absolute Error (MAE) & Root Mean Squared Error (RMSE)
    – Backtesting and rolling forecasts
  • Hands-on:
    – Analyze and forecast stock prices using ARIMA
    – Implement seasonal decomposition to identify patterns
    – Use Prophet to predict future trends in a real-world dataset

Module 9: Data Visualization

Topic: Using Looker, Flourish, and Power BI/Tableau

  • Introduction to Visualization Tools
    – Overview of Looker, Flourish, Power BI, and Tableau
    – Key differences and use cases for each tool
  • Building Effective Reports
    – Connecting to databases and importing data
    – Creating real-time reports and automated updates
  • Advanced Visualizations & Custom Reports
    – Geo-mapping, time-series analysis, and custom themes
    – Embedding reports into web applications
  • Hands-on:
    – Build an interactive Power BI/Tableau dashboard
    – Create a custom Flourish visualization for storytelling
    – Develop a Looker report with real-time data filtering

Topic: Interactive Dashboards

  • Principles of Dashboard Design
    – Understanding user needs and UX best practices
    – Structuring dashboards for clarity and usability
  • Adding Interactivity
    – Using filters, drill-throughs, and dynamic visuals
    – Automating updates and real-time data streaming
  • Performance Optimization
    – Reducing load times with optimized data queries
    – Handling large datasets efficiently
  • Hands-on:
    – Design a real-world business intelligence dashboard
    – Implement interactive filters to personalize insights
    – Optimize a dashboard for performance and user engagement

Module 10: Creating Data Driven Strategy & Executive Dashboard

Topic: Presenting Insights Effectively

  • Storytelling with Data
    – Structuring insights in a way that drives action
    – Using narratives to make data compelling
  • Visualization & Reporting Techniques
    – Choosing the right charts for different insights
    – Avoiding common visualization mistakes
  • Delivering Impactful Data Presentations
    – Executive communication strategies
    – Handling questions and objections during presentations
  • Hands-on:
    – Craft a data-driven business narrative
    – Design clear, executive-friendly slides for insights presentation
    – Simulate an executive briefing with Q&A

Topic: Hands-on: Building an executive dashboard in Power BI/Tableau

  • Data Preparation & Cleaning
    – Connecting to data sources and cleaning raw data
    – Structuring data models for dashboard efficiency
  • Building the Dashboard
    – Implementing KPIs, visualizations, and interactive elements
    – Adding filters, drill-downs, and real-time updates
  • Deployment & Automation
    – Publishing dashboards for executive access
    – Automating data refresh and alerts
  • Hands-on:
    – Build an executive dashboard prototype with KPIs
    – Implement interactive filters and drill-down features
    – Deploy the dashboard and generate an automated executive report

Module 2: Statistic for Data Analyst

Topic: Descriptive Analysis

  • Introduction to Descriptive Analytics
    – Role in Business Intelligence & Decision-Making
    – Differences Between Descriptive, Prescriptive & Predictive Analytics
  • Techniques & Methods in Descriptive Analytics
    – Data Summarization & Aggregation
    – Measures of Central Tendency (Mean, Median, Mode)
    – Measures of Dispersion (Variance, Standard Deviation)
    – Data Visualization & Reporting (Using Python, Tableau, or Power BI)
  • Hands-on:
    Analyzing Real-World Business Datasets
    Generating Descriptive Reports & Dashboards

Topic: Prescriptive Analysis

  • Introduction to Prescriptive Analytics
    – How it Differs from Descriptive & Predictive Analytics
    – Applications in Finance, Healthcare, Marketing, and Operation
  • Techniques in Prescriptive Analytics
    – Decision Trees & Rule-Based Models
    – Optimization Algorithms (Linear & Non-Linear Programming)
    – Machine Learning for Prescriptive Analytics (Reinforcement Learning, AI-driven Recommendations)
  • Implementation in Business Strategy
    – Scenario Modeling & “What-If” Analysis
    – Prescriptive Analytics in Marketing Campaigns, Risk Assessment, and Supply Chain Optimization
  • Hands-on:
    – Building a Prescriptive Analytics Model Using Python & Solver
    – Simulating Decision-Making Scenarios

Module 3: Fundamental for Coding in Python

Topic: Python Basics: Variables, Data Types, and Functions

  • Introduction to Python and Jupyter Notebooks
    Variables, Data Types (Strings, Integers, Floats, Booleans)
    Data Structures (Lists, Tuples, Sets, Dictionaries)
    Functions and Lambda Expressions
    Error Handling and Debugging
  • Introduction to Python for Data Science
    – Why Python is widely used in data science
    – Setting up the environment (Jupyter Notebook, VS Code)
  • Variables and Data Types
    – int, float, string, list, tuple, dict, set
    – Type conversion and memory efficiency
  • Functions and Code Modularity
    – Defining functions, parameters, return values
    – Lambda functions and built-in functions (map, filter, reduce)
  • Hands-on:
    – Writing Python scripts to manipulate variables and data types
    – Implementing functions to process and transform simple datasets

Topic: Control Flow (Loops, Conditions)

  • Conditional Statements :
    – if, elif, and else statements
    – Using logical operators (and, or, not) in conditions and Nested conditionals
  • Loops :
    – For Loop: Iterating over a range, lists, and other collections
    – While Loop: Repeating code as long as a condition is true
    – Loop control: break, continue, pass and Nested loops

Module 3: Fundamental for Coding in Python

Topic: Working with Libraries (Pandas, NumPy, Matplotlib)

  • Pandas:
    – Introduction to Pandas DataFrame and Series
    – Creating DataFrames from lists, dictionaries, or CSV files
    – DataFrame indexing and selection
    – Handling missing data (e.g., NaN values)
    – Data manipulation: filtering, sorting, aggregating, and grouping
  • NumPy:
    – Introduction to NumPy arrays
    – Creating arrays: np.array(), np.zeros(), np.ones(), np.arange()
    – Array slicing and indexing
    – Vectorized operations for efficiency
    – Mathematical functions in NumPy (e.g., sum, mean, standard deviation)
  • Matplotlib:
    – Introduction to data visualization with Matplotlib
    – Creating simple plots: line, bar, scatter, histogram
    – Customizing plots: labels, titles, legends, colors
    – Saving plots to files
  • Hands-on: Writing Python scripts to manipulate data

Topic: Correlation vs. Causation

  • Data Normalization:
    – Standardization (Z-score) vs. Min-Max Scaling
    – When to Normalize Data & Impact on Machine Learning Models
  • Outlier Detection:
    – Box Plot & Z-Score Method
    – Mahalanobis Distance & Isolation Forest
    – Handling Outliers: Removal vs. Transformation
  • Hand-on: Detecting & handling outliers in a dataset using Python (Scikit-learn)

Module 4: Mathematics for Phyton

Topic: Applying mathematical concepts in Python for data processing

  • Python for Numerical Computing
    – NumPy for vectorized operations
    – Pandas for data manipulation
    – Matplotlib & Seaborn for data visualization
  • Statistical & Machine Learning Applications
    – Scikit-learn for regression and classification models
    – SciPy for statistical analysis
    – TensorFlow/PyTorch for deep learning fundamentals
  • Real-World Case Studies
    – Fraud detection using probability distributions
    – Optimizing ad placements with linear algebra
    – Forecasting trends with time series analysis
  • Hands-on:
    – Implement data processing pipelines using NumPy and Pandas
    – Apply regression analysis using Scikit-learn
    – Perform clustering using k-means and hierarchical clustering
    – Develop a mini-project applying mathematical concepts in a real dataset

Topic: ETL (Extract, Transform, Load) Process

  • Understanding the ETL Pipeline
    – Extracting Data from Multiple Sources
    – Data Transformation Techniques (Aggregation, Normalization)
    – Data Loading Strategies (Batch vs. Streaming)
  • ETL Tools & Frameworks
    – Apache Airflow for Workflow Automation
    – Data Pipelines with Python (Pandas, PySpark)
    – Cloud-based ETL (AWS Glue, Google Dataflow)
  • Hand-on:
    – Building an ETL pipeline to extract, clean, and load data into a database

Module 5: SQL for Data Analysis

Topic: Advanced SQL Queries (Subqueries, Window Functions)

  • Using Subqueries for Data Processing
    – Inline subqueries vs. correlated subqueries
    – Filtering and transforming data using subqueries
  • Window Functions for Analytical Queries
    – RANK(), DENSE_RANK(), ROW_NUMBER()
    – LEAD() and LAG() for trend analysis
    – Using PARTITION BY and ORDER BY for advanced calculations
  • Common Table Expressions (CTEs) & Recursive Queries
    – Improving query readability with CTEs
    – Writing recursive queries for hierarchical data
  • Hands-on:
    – Write subqueries to filter and transform datasets
    – Use window functions to rank sales performance
    – Implement CTEs to simplify complex queries

Topic: Database Management & Optimization

  • Indexing for Performance Optimization
    – Types of indexes: clustered, non-clustered, composite
    – When and how to use indexing effectively
  • Query Performance Tuning & Optimization
    – EXPLAIN ANALYZE for query execution plans
    – Reducing query load with indexing and partitioning
    – Optimizing JOINs and subqueries
  • Database Transactions & ACID Principles
    – Ensuring data integrity with transactions
    – Using COMMIT, ROLLBACK, and SAVEPOINT
  • Hands-on:
    – Create and analyze indexes for performance improvement
    – Optimize a slow query using indexing and partitioning
    – Implement ACID-compliant transactions in SQL

Module 6: Chat GPT for Data Analysis

Topic: ChatGPT for SQL Query Assistance & Python Code Generation

  • Generating SQL Queries with ChatGPT
    – Automating query generation and optimization
    – Fixing and debugging SQL queries with AI assistance
  • Writing Python Scripts for Data Processing
    – Automating data analysis workflows with AI-generated scripts
    – Enhancing Python code with AI-generated improvements
  • Using AI for Data Science & Machine Learning
    – Leveraging ChatGPT for feature engineering
    – Automating model selection and hyperparameter tuning
  • Hands-on:
    – Generate and optimize SQL queries using ChatGPT
    – Automate Python script creation for data analysis
    – Debug AI-generated SQL and Python code for efficiency

Module 7: Digital Data Analysis

Topic: Data-Driven Marketing Strategies

  • Using Data to Optimize Marketing Campaigns
    – Identifying high-performing channels and audience segments
    – Budget allocation based on ROI and conversion tracking
  • Predictive Analytics for Marketing
    – Using historical data to forecast campaign success
    – Personalization strategies using AI-driven customer insights
  • Attribution Models & Customer Journey Analysis
    – Understanding first-touch, last-touch, and multi-touch attribution
    – Mapping user journeys to optimize conversion funnels
  • Hands-on:
    – Analyze real-world marketing campaign data and optimize strategies
    – Develop customer journey maps using real analytics data
    – Build a marketing performance dashboard to track campaign success

Module 8: Advance Data Analysis

Topic: Data Wrangling & Cleaning Techniques

  • Handling Missing Data & Outliers
    – Imputation techniques (mean, median, mode)
    – Detecting and treating outliers
  • Feature Engineering & Selection
    – Creating new variables for better model performance
    – Removing multicollinearity and redundant features
  • Data Transformation & Encoding
    – Scaling (MinMax, StandardScaler)
    – Encoding categorical variables (One-Hot Encoding, Label Encoding)
  • Hands-on Activities:
    – Clean a raw dataset by handling missing values and outliers
    – Perform feature selection for a machine learning model
    – Transform a real-world dataset and prepare it for predictive analysis

Topic: Implementing predictive models in Python

  • Hands-on:
    – Build a real-world predictive model from scratch using Python
    – Create a dashboard to visualize predictions and insights

Module 9: Data Visualization

Topic: Best Practices for Data Storytelling

  • Principles of Data Storytelling
    – Understanding the audience and defining key messages
    – Structuring data-driven narratives
  • Choosing the Right Visuals
    – When to use bar charts, line charts, scatter plots, and heatmaps
    – Common visualization mistakes and how to avoid them
  • Enhancing Engagement with Interactivity
    – Adding filters, tooltips, and dynamic elements
    – Customizing dashboards for different stakeholders
  • Hands-on:
    – Create a story-driven data report from a real-world dataset
    – Transform complex data into a simple, compelling visual narrative
    – Apply color, typography, and layout best practices in a presentation

Module 10: Creating Data Driven Strategy & Executive Dashboard

Topic: Business Intelligence & Decision-Making Frameworks

  • Introduction to Business Intelligence (BI)
    – What is BI? Overview of tools and methodologies
    – The role of BI in data-driven organizations
  • Decision-Making Frameworks
    – Data-Informed vs. Data-Driven Decision Making
    – Key frameworks: OODA Loop, PDCA, and SWOT Analysis
    – Aligning BI insights with business goals
  • BI Tools & Technologies
    – Power BI, Tableau, Looker, and Google Data Studio
    – Integrating BI with cloud data sources
  • Hands-on:
    – Case study: Applying a BI framework to a business scenario
    – Explore real-world BI tools and their applications
    – Design a basic BI workflow for data-driven decision-making

Topic: Designing Dashboards for Executives
  • Understanding Executive Needs
    – What executives look for in dashboards
    – Defining Key Performance Indicators (KPIs) and success metrics
  • Principles of Executive Dashboard Design
    – High-level overviews vs. deep-dive data
    – Data visualization techniques for summarizing insights
  • Optimizing User Experience (UX) for Dashboards
    – Simplifying navigation and interactivity
    – Ensuring readability and visual hierarchy
  • Hands-on:
    – Identify relevant KPIs for an executive dashboard
    – Wireframe and prototype an executive-level BI dashboard
    – Optimize data filtering for quick high-level analysis

Module 11: Project Portofolio

Topic: Projects

Topic: Assesment / Uji Kompetensi

Premium

Rp.7.000.000

Umum

Rp.5.500.000

Mahasiswa

Rp.3.500.000

Frequently Asked Question

Tidak. Kursus ini dirancang dan disesuaikan  untuk pemula , mahasiswa, umum dan profesional tanpa latar belakang IT. Materi disusun secara bertahap, mulai dari dasar hingga tingkat lanjut, sehingga dapat diikuti oleh siapa saja.

Ya. Setelah menyelesaikan seluruh materi dan tugas yang diberikan, Anda akan menerima sertifikat resmi dikeluarkan oleh CCIT FT Universitas Indonesia (UI) yang dapat digunakan untuk melamar pekerjaan atau menambah portofolio profesional.

Kursus ini menggunakan metode blended learning, yaitu kombinasi antara:

  • Belajar mandiri melalui platform e-learning, di mana peserta dapat mengakses materi, video, dan tugas kapan saja.
  • Virtual meet via Zoom (live session) bersama mentor, dijadwalkan secara rutin untuk diskusi, tanya jawab, atau membahas topik penting secara interaktif.
    Metode ini memberikan fleksibilitas belajar sekaligus pengalaman interaktif dengan pendampingan mentor.

Ya. Kami menyediakan forum diskusi, sesi tanya jawab bersama mentor, serta dukungan teknis untuk membantu Anda selama proses belajar.

Untuk kursus secara umum (selain Mobile Development), perangkat minimal yang disarankan adalah:

  • Prosesor: Minimal Dual-core, seperti Intel Core i3 generasi ke-6 atau AMD Ryzen 3 2200U
  • RAM: Minimal 4GB (disarankan 8GB)
  • Sistem Operasi: Windows 10, macOS 10.13 atau versi lebih baru
  • Koneksi Internet: Stabil, minimal 10 Mbps

    Untuk kursus Mobile Development dan Game Development, disarankan:
  • Prosesor: Quad-core, seperti Intel Core i5 generasi ke-8 atau AMD Ryzen 5 3500U
  • RAM: Minimal 8GB (disarankan 12GB atau lebih)
  • Penyimpanan: SSD minimal 256GB

Ya. Kursus ini bekerja sama dengan CCIT FT Universitas Indonesia, sehingga sertifikat yang diterbitkan memiliki kredibilitas tinggi dan dapat menjadi nilai tambah pada CV Anda.

Durasi kelas intensive bootcamp adalah 3 bulan, dengan sesi live melalui Zoom 2 kali dalam seminggu, masing-masing berdurasi 3 jam. Jadwal berlangsung pada hari kerja (weekdays) pukul 19.00 – 22.00 WIB atau hari libur (weekend) pukul 09.00 - 12.00

Durasi kelas fast track adalah 5 hari, dengan sesi live melalui Zoom 5 kali dalam seminggu, masing-masing berdurasi 3 jam. Jadwal berlangsung pada hari kerja (weekdays) pukul 19.00 – 22.00 WIB atau hari libur (weekend) pukul 09.00 - 12.00

Ya. Materi kursus dapat diakses kapan saja melalui platform LMS atau LXP, sehingga Anda bisa belajar secara fleksibel di luar jadwal live session.

Ya. Tugas diberikan di setiap akhir pertemuan. Selain itu, peserta akan mengerjakan proyek nyata (real project) sebagai bagian dari proses belajar dan portofolio.

Ya. Kursus ini berbayar, namun Anda akan mendapatkan akses seumur hidup ke seluruh materi pembelajaran, termasuk video, modul, dan forum diskusi.

Ya. Peserta akan mendapatkan bimbingan langsung dari mentor profesional, serta akses ke group chat khusus untuk berdiskusi dan berkonsultasi.

Tidak ada tes masuk untuk dapat mengikuti program di Digiskill Hub, semua orang dengan latar belakang apapun dapat mengikuti program ini

Ingin belajar skill digital menarik lainnya?

Kami juga ada program Intensive Bootcamp lainnya — pembelajaran mendalam dan langsung praktik bareng mentor!